Answer Insights: show your leads how they compare – live

You finish an assessment. 68 out of 100.
Is that good? Better than most? Worse? Without context, a score is just a number – and numbers on their own don’t make anyone act.
That’s why we built Answer Insights: new result page sections that show your leads not just their score, but how their answers compare with everyone else who’s taken your assessment. Live, per question, updating with every new response.
We’re proving it at scale right now
We didn’t just ship the feature – we built something with it.
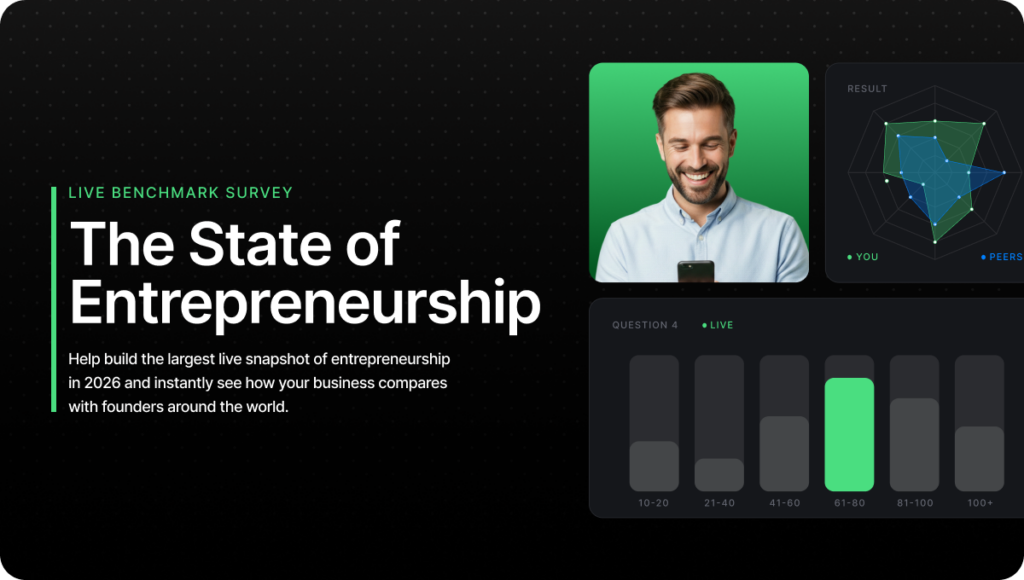
The State of Entrepreneurship 2026 is a live global benchmark where thousands of founders, coaches, consultants, agency owners, and creators are answering honestly about revenue, AI, growth, and mindset.
The moment you complete it, you see how your answers compare with everyone who contributed before you. Not a report you’ll wait six months for – a living dataset that gets sharper with every response.
Take it. That feeling when the charts appear next to your answers? That’s what your leads will feel on your result pages.
How it works
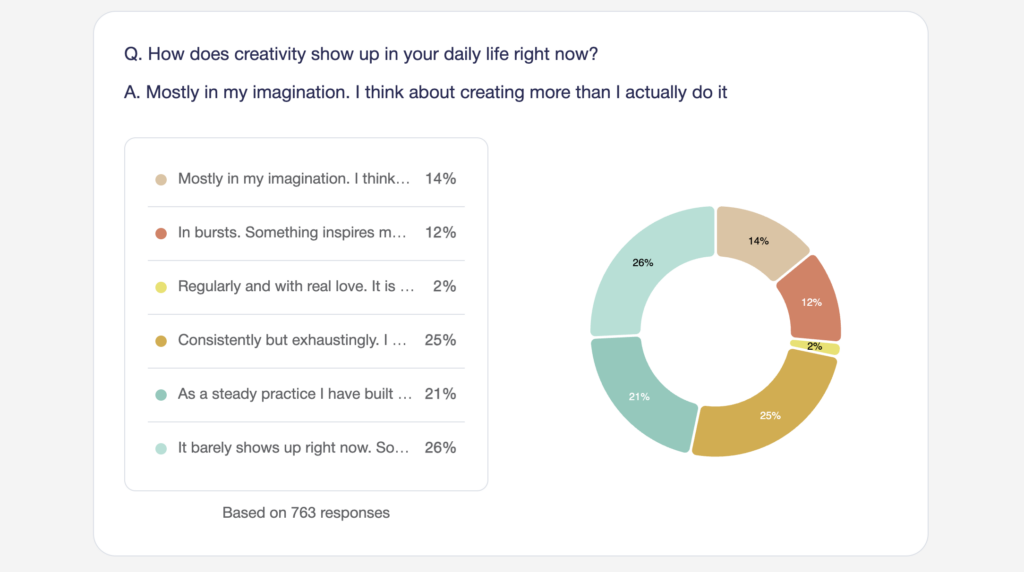
Answer Insights is a new category of result page sections – donut, pie, or the new bar charts – showing how all respondents answered each question. “60% picked this. 20% picked that. Here’s you.”
A few details we sweated:
A minimum-response threshold. By default, charts unlock at 20 completed responses. Before that, leads see “Insights available after 20 responses – 5 collected so far”, which builds anticipation rather than showing thin data. Set it anywhere from 0 (show from the first response) to whatever you like.
Trustworthy numbers. Only completed responses count – no half-finished attempts skewing your benchmarks. And if a lead never saw a question due to jump logic, it won’t appear in their results.
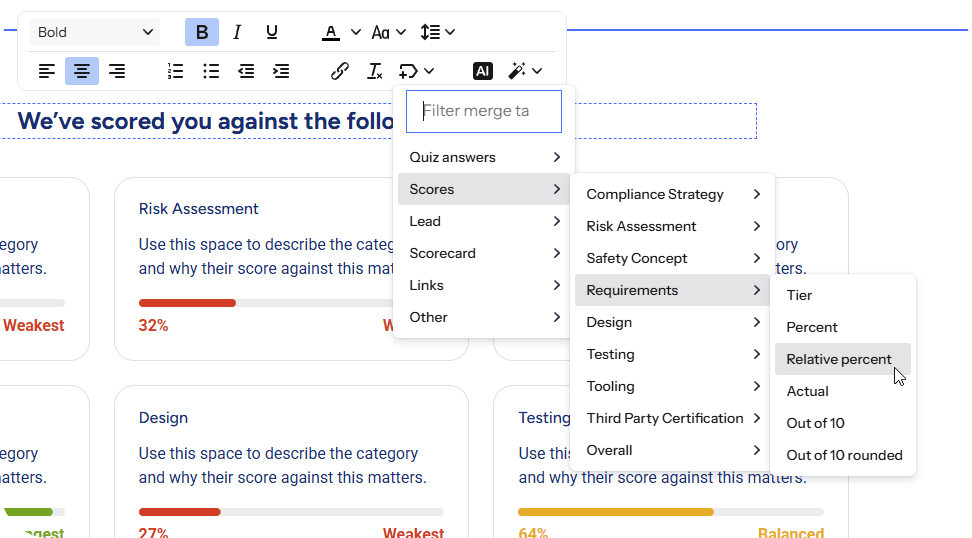
Your look, your words. Chart colors, layout (alternating, left, or right), and every line of text is editable. New merge tags for question, answer, and response count work across all pages, links, and emails.
It works with every question type except open text, and there’s a ready-made result page template with Answer Insights already built in.
Why this changes your result pages
Comparison is the moment a lead self-qualifies. Seeing they’re behind their peers creates the urgency that books the call. Seeing they’re ahead creates the confidence to buy. Either way, they keep scrolling, they talk about it, and they come back to see how the numbers move.
Your assessment stops being a score generator and becomes a benchmark people want to be part of.
Try it yourself
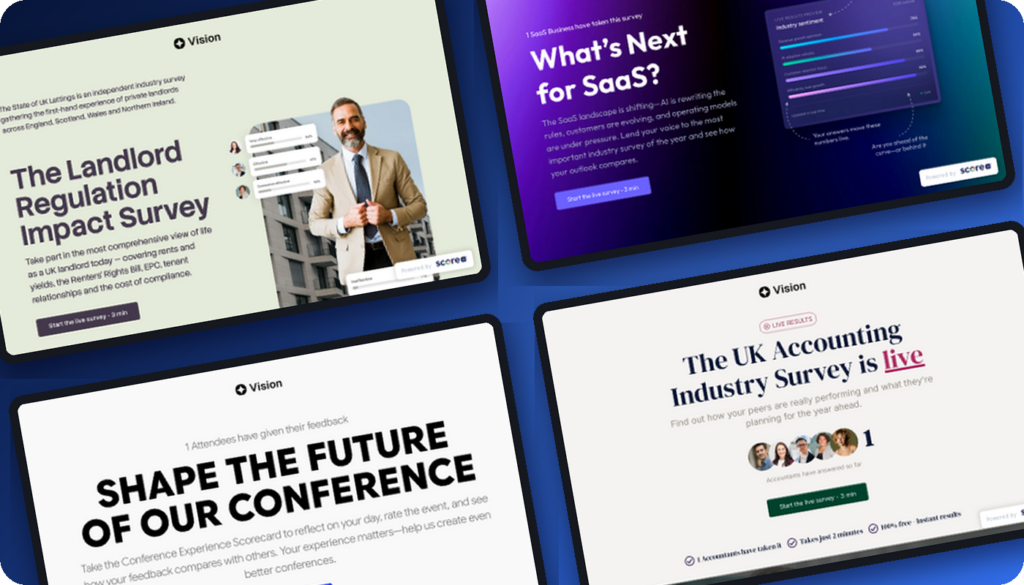
We’ve built 4 ready-made templates with Answer Insights sections already in place. Pick one, make it yours, and start collecting answers worth comparing.